
South Alaska Peninsula Chum Salmon
2023 Results
Background
The South Alaska Peninsula commercial salmon fishery occurs in the Alaska Peninsula Management Area and is regulated by multiple board-approved management plans. Relatively large harvests of chum salmon in South Alaska Peninsula fisheries in recent years corresponding with small returns of chum salmon to Western Alaska raised concerns among stakeholders about the stock-specific harvests in South Alaska Peninsula fisheries. A study was designed to estimate stock, age, and length compositions and stock-specific harvests in South Alaska Peninsula fisheries in 2022–2026. This webpage contains preliminary results from the second year of this study (the 2023 commercial fishery).
Preliminary 2023 Results
Preliminary estimates of the 2023 commercial salmon harvest in the South Alaska Peninsula totaled 11,067 Chinook, 1,740,707 sockeye, 197,656 coho, 17,097,391 pink, and 1,120,863 chum salmon (Keyse and Russell 2023). The commercial salmon harvest for the June fishery consisted of 1,824 Chinook, 857,150 sockeye, 272 coho, 221,605 pink, and 205,522 chum salmon. The sockeye and chum salmon harvest in the South Unimak and Shumagin Islands June fisheries were below the most recent 10-year average of 1,582,765 sockeye salmon and 523,443 chum salmon. The total commercial harvest for the South Peninsula post-June fishery was 8,354 Chinook, 759,246 sockeye, 181,661 coho, 14,335,088 pink, and 808,033 chum salmon.
A total of 16,309 chum salmon were sampled for tissues for genetic analysis and 10,904 samples were selected for mixed stock analysis to represent 31 spatiotemporal strata. These strata represented harvest in two areas (Unimak and Southwestern districts and South Central and Southeastern districts), two gear types (seine and gillnet), and multiple time periods within the June and post-June fisheries in a design similar to 2022.
The total June fishery harvest across all districts, gear types, and strata was smaller than July and August harvests, with a total June harvest of 206,037 chum salmon. The Asia group contributed the largest proportion of the harvest in June with an estimated 81,411 fish (39.5%; Table 1). The CWAK group had the second largest contribution with an estimated 58,497 fish (28.4%) and the East of Kodiak group contributed an estimated 41,118 fish (20.0%). Harvests from other reporting groups were relatively small.
The post-June fishery harvest across all districts, gear types, and strata totaled 915,151 chum salmon. The South Peninsula group contributed the largest proportion of the harvest with an estimated 459,955 fish (50.3%; Table 2). The Chignik/Kodiak group had the second largest contribution with an estimated 246,602 fish (26.9%) and the Asia group contributed an estimated 105,003 fish (11.5%). Harvests from other reporting groups were relatively small.
The total South Peninsula fishery harvest across all districts, gear types, and strata totaled 1,121,357 chum salmon. The South Peninsula group contributed the largest proportion of the harvest with an estimated 465,043 fish (41.5%; Table 3). The Chignik/Kodiak group had the second largest contribution with an estimated 257,105 fish (22.9%) and the Asia group contributed an estimated 186,364 fish (16.6%). Harvests from other reporting groups were relatively small.
Comparing to averages across the 3 WASSIP years, the relative presence of Asia and East of Kodiak groups in June harvests for 2022 and 2023 were greater than in 2007–2009 with a relative decrease in CWAK abundance (Figure 1). In the post-June fisheries local stocks were a larger proportion of the harvest in 2022 and 2023 compared to 2007–2009. Contributions to the post-June fishery increased from Chignik/Kodiak and East of Kodiak in 2022 and 2023 relative to 2007–2009, whereas South Peninsula decreased. No other stocks exhibited differences greater than 5% between the WASSIP years and 2022 and 2023 in either fishery.
Per ADF&G policy and best practices, comprehensive reporting of results will take place after three years of data collection to gain a measure of interannual variation. Published results are expected in 2025 with results from 2022 through 2024. Results from a 2007 through 2009 study (Western Alaska Salmon Stock Identification Program, WASSIP) are available in Munro et al. (2012), and results from 2022 are available in Dann et al. (2023) and ADF&G (2023).
References
ADF&G (Alaska Department of Fish and Game). 2023. Preliminary harvest rates of western Alaska and Alaska Peninsula chum salmon stocks in South Alaska Peninsula fisheries, 2022. (PDF 3,667 kB) Alaska Department of Fish and Game, Division of Commercial Fisheries, Regional Information Report No. 5J23-02, Anchorage.
Dann, T. H., H. A. Hoyt, E. M. Lee, E. K. C. Fox, and M. B. Foster. 2023. Genetic stock composition of chum salmon harvested in commercial salmon fisheries of the South Alaska Peninsula, 2022. (PDF 5,188 kB) Alaska Department of Fish and Game, Special Publication No. 23-07, Anchorage.
Keyse, M and C. Russell. 2023. 2023 Alaska Peninsula and Aleutian Islands Salmon Season Summary. Alaska Department of Fish and Game, Division of Commercial Fisheries, News Release, Juneau, AK. Issued November 1, 2023. https://adfg.alaska.gov/static/applications/dcfnewsrelease/1445996671.pdf (PDF 669 kB) (accessed December 20, 2023).
Munro, A. R., C. Habicht, T. H. Dann, D. M. Eggers, W. D. Templin, M. J. Witteveen, T. T. Baker, K. G. Howard, J. R. Jasper, S. D. Rogers Olive, H. L. Liller, E. L. Chenoweth, and E. C. Volk. 2012. Harvest and harvest rates of chum salmon stocks in fisheries of the Western Alaska Salmon Stock Identification Program (WASSIP), 2007–2009 (PDF 11,706 kB). Alaska Department of Fish and Game, Special Publication No. 12-25, Anchorage.
Table 1. — Preliminary reporting-group specific stock composition and harvest estimates for South Peninsula area, June 2023, all strata. Median, 90% credibility intervals, means, and SDs are reported.
| Proportions (%) | Harvest = 206,037; 13 Strata | |||||||||
|---|---|---|---|---|---|---|---|---|---|---|
| 90% CI | 90% CI | |||||||||
| Reporting Group | Median | 5% | 95% | Mean | SD | Median | 5% | 95% | Mean | SD |
| Asia | 39.5 | 37.9 | 41.0 | 39.5 | 0.9 | 81,362 | 77,202 | 85,694 | 81,411 | 2,516 |
| Kotzebue Sound | 1.7 | 1.0 | 2.4 | 1.7 | 0.4 | 3,412 | 2,093 | 4,978 | 3,456 | 888 |
| CWAK | 28.4 | 26.8 | 29.9 | 28.4 | 0.9 | 58,437 | 54,915 | 62,164 | 58,497 | 2,190 |
| Upper Yukon | 0.6 | 0.3 | 1.1 | 0.6 | 0.2 | 1,277 | 586 | 2,153 | 1,314 | 475 |
| Northern Dist. | 1.0 | 0.5 | 1.6 | 1.0 | 0.3 | 2,006 | 1,063 | 3,289 | 2,084 | 687 |
| Northwestern Dist. | 1.4 | 0.9 | 1.9 | 1.4 | 0.3 | 2,782 | 1,943 | 3,858 | 2,838 | 584 |
| South Peninsula | 2.2 | 1.2 | 3.8 | 2.3 | 0.8 | 4,585 | 2,454 | 7,891 | 4,830 | 1,729 |
| Chignik/Kodiak | 5.2 | 3.4 | 6.7 | 5.1 | 1.0 | 10,643 | 6,898 | 13,750 | 10,489 | 2,123 |
| East of Kodiak | 19.9 | 18.7 | 21.3 | 20.0 | 0.8 | 41,051 | 38,495 | 43,991 | 41,118 | 1,682 |
| Total | 206,037 | |||||||||
Note: Harvest is the number of chum salmon reported to have been harvested in the June fisheries of the South Peninsula. Harvest total may differ from totals in experimental design table due to rounding error.
Table 2. — Preliminary reporting-group specific stock composition and harvest estimates for South Peninsula Area, post-June 2023, all strata. Median, 90% credibility intervals, means, and SDs are reported.
| Proportions (%) | Harvest = 915,151; 18 Strata | |||||||||
|---|---|---|---|---|---|---|---|---|---|---|
| 90% CI | 90% CI | |||||||||
| Reporting Group | Median | 5% | 95% | Mean | SD | Median | 5% | 95% | Mean | SD |
| Asia | 11.5 | 10.6 | 12.3 | 11.5 | 0.5 | 104,916 | 97,194 | 113,332 | 105,003 | 4,870 |
| Kotzebue Sound | 0.2 | 0.1 | 0.4 | 0.2 | 0.1 | 1,942 | 642 | 3,858 | 2,046 | 986 |
| CWAK | 2.6 | 2.2 | 3.1 | 2.6 | 0.3 | 23,674 | 19,873 | 27,958 | 23,734 | 2,473 |
| Upper Yukon | 0.2 | 0.1 | 0.4 | 0.2 | 0.1 | 2,093 | 1,090 | 3,509 | 2,175 | 748 |
| Northern Dist. | 0.9 | 0.5 | 1.3 | 0.9 | 0.2 | 7,828 | 4,984 | 12,234 | 8,126 | 2,282 |
| Northwestern Dist. | 2.5 | 1.9 | 3.1 | 2.5 | 0.3 | 22,501 | 17,763 | 27,998 | 22,696 | 3,136 |
| South Peninsula | 50.3 | 46.6 | 53.8 | 50.3 | 2.2 | 459,684 | 424,340 | 495,419 | 459,955 | 21,211 |
| Chignik/Kodiak | 26.8 | 23.5 | 30.7 | 26.9 | 2.2 | 245,795 | 214,701 | 282,709 | 246,602 | 20,716 |
| East of Kodiak | 4.9 | 4.1 | 5.8 | 4.9 | 0.5 | 44,562 | 37,670 | 52,764 | 44,814 | 4,585 |
| Total | 915,151 | |||||||||
Note: Harvest is the number of chum salmon reported to have been harvested in the post-June fisheries of the South Peninsula. Harvest total may differ from totals in experimental design table due to rounding error.
Table 3. — Preliminary reporting-group specific stock composition and harvest estimates for South Peninsula Area, 2023, all strata. Median, 90% credibility intervals, means, and SDs are reported.
| Proportions (%) | Harvest = 1,121,357; 31 Strata | |||||||||
|---|---|---|---|---|---|---|---|---|---|---|
| 90% CI | 90% CI | |||||||||
| Reporting Group | Median | 5% | 95% | Mean | SD | Median | 5% | 95% | Mean | SD |
| Asia | 16.6 | 15.9 | 17.4 | 16.6 | 0.5 | 186,251 | 177,484 | 195,478 | 186,364 | 5,431 |
| Kotzebue Sound | 0.5 | 0.3 | 0.7 | 0.5 | 0.1 | 5,453 | 3,432 | 7,877 | 5,497 | 1,345 |
| CWAK | 7.3 | 6.8 | 7.8 | 7.3 | 0.3 | 82,091 | 77,017 | 87,770 | 82,190 | 3,237 |
| Upper Yukon | 0.3 | 0.2 | 0.5 | 0.3 | 0.1 | 3,404 | 2,211 | 5,073 | 3,484 | 869 |
| Northern Dist. | 0.9 | 0.6 | 1.3 | 0.9 | 0.2 | 9,950 | 6,832 | 14,506 | 10,210 | 2,403 |
| Northwestern Dist. | 2.3 | 1.8 | 2.8 | 2.3 | 0.3 | 25,378 | 20,444 | 31,122 | 25,539 | 3,216 |
| South Peninsula | 41.5 | 38.3 | 44.5 | 41.5 | 1.8 | 465,101 | 427,642 | 502,082 | 465,043 | 22,415 |
| Chignik/Kodiak | 22.8 | 20.1 | 26.0 | 22.9 | 1.8 | 256,039 | 224,397 | 293,074 | 257,105 | 20,564 |
| East of Kodiak | 7.6 | 7.0 | 8.4 | 7.7 | 0.4 | 85,603 | 78,418 | 94,753 | 85,924 | 4,889 |
| Total | 1,121,357 | |||||||||
Note: Harvest is the number of chum salmon reported to have been harvested in the fisheries of the South Peninsula. Harvest total may differ from totals in experimental design table due to rounding error.
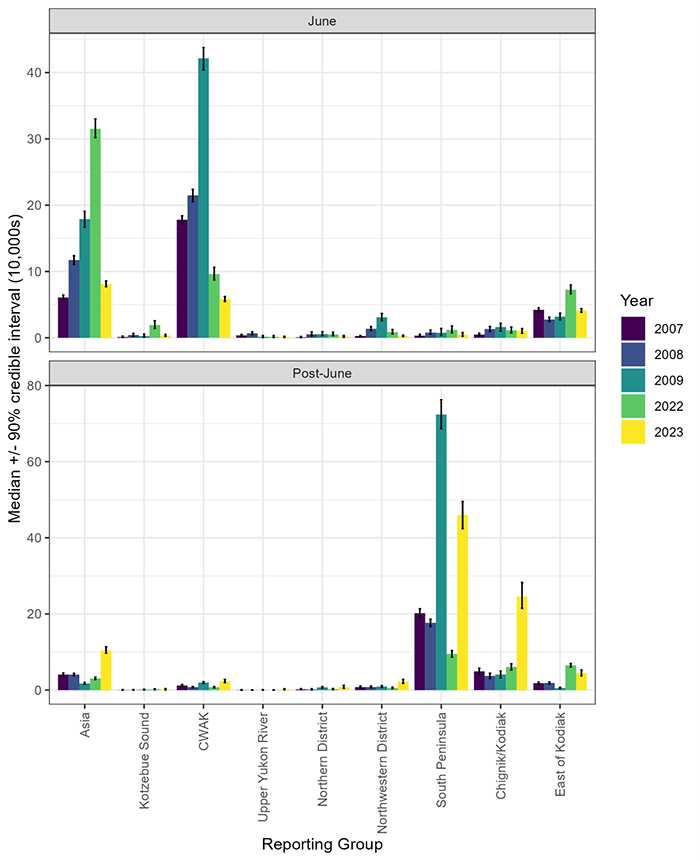
Figure 1. — Stratified estimates of median reporting group stock-specific harvests (10,000s of fish) and 90% credibility intervals for chum salmon sampled from the June (top panel) and post-June (bottom panel) fisheries in the South Alaska Peninsula in 2007, 2008, 2009, 2022, and 2023.