Fish Count Data Search
|
Location: Kenai River (late-run sockeye) |
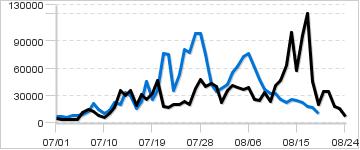
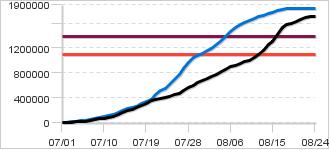
The selected years are color-coded in the graphs below:
|
Daily Counts

|
Cumulative
|
|
Description: The DIDSON (sonar) is used to estimate passage of late-run sockeye salmon at river mile 19 of the Kenai River. The department manages Kenai River late-run sockeye salmon to achieve a sustainable escapement goal (SEG), and also follows inriver management targets established by the Alaska Board of Fisheries. The primary inseason management target for late-run Kenai River sockeye salmon is the inriver goal. These inriver goals vary year to year depending on the estimated run size in the Kenai River. The sockeye salmon sonar enumeration process uses a fish wheel to determine the proportions and counts of pink, coho, and chum salmon each day.
Inriver Goal for Sockeye in 2022:
1,100,000 - 1,400,000
(Graphed above)
|
|
|
Contact:
Upper Cook Inlet Assnt. Comm Fish Biologist, | |
55 records returned for the years selected. Dashes indicate days with no count.
[Export results in Excel format or JSON format]
| Date 2020 |
Count 2020 |
Cumulative 2020 |
Cumulative 2019 |
Notes for 2020 |
|---|---|---|---|---|
| Aug-24 | 6,708 | 1,714,565 | 1,849,054 | *data adjusted using logistic regression |
| Aug-23 | 16,512 | 1,707,857 | 1,849,054 | *data adjusted using logistic regression |
| Aug-22 | 17,777 | 1,691,345 | 1,849,054 | *data adjusted using logistic regression |
| Aug-21 | 34,459 | 1,673,568 | 1,849,054 | *data adjusted using logistic regression |
| Aug-20 | 34,742 | 1,639,109 | 1,849,054 | *data adjusted using logistic regression |
| Aug-19 | 20,052 | 1,604,367 | 1,849,054 | *data adjusted using logistic regression |
| Aug-18 | 46,259 | 1,584,315 | 1,838,923 | *data adjusted using logistic regression |
| Aug-17 | 121,031 | 1,538,056 | 1,822,160 | *data adjusted using logistic regression |
| Aug-16 | 96,766 | 1,417,025 | 1,804,014 | *data adjusted using logistic regression |
| Aug-15 | 57,310 | 1,320,259 | 1,781,794 | *data adjusted using logistic regression |
| Aug-14 | 99,875 | 1,262,949 | 1,756,886 | *data adjusted using logistic regression |
| Aug-13 | 62,807 | 1,163,074 | 1,731,077 | *data adjusted using logistic regression |
| Aug-12 | 47,067 | 1,100,267 | 1,708,919 | *data adjusted using logistic regression |
| Aug-11 | 41,832 | 1,053,200 | 1,683,542 | *data adjusted using logistic regression |
| Aug-10 | 24,163 | 1,011,368 | 1,651,396 | *data adjusted using logistic regression |
| Aug-09 | 34,137 | 987,205 | 1,618,637 | *data adjusted using logistic regression |
| Aug-08 | 24,396 | 953,068 | 1,581,595 | *data adjusted using logistic regression |
| Aug-07 | 25,368 | 928,672 | 1,533,549 | *data adjusted using logistic regression |
| Aug-06 | 38,712 | 903,304 | 1,472,285 | *data adjusted using logistic regression |
| Aug-05 | 36,938 | 864,592 | 1,395,891 | *data adjusted using logistic regression |
| Aug-04 | 38,859 | 827,654 | 1,323,179 | *data adjusted using logistic regression |
| Aug-03 | 41,814 | 788,795 | 1,260,492 | *data adjusted using logistic regression |
| Aug-02 | 35,719 | 746,981 | 1,204,562 | *data adjusted using logistic regression |
| Aug-01 | 23,055 | 711,262 | 1,162,478 | *data adjusted using logistic regression |
| Jul-31 | 40,718 | 688,207 | 1,124,767 | |
| Jul-30 | 43,048 | 647,489 | 1,090,452 | |
| Jul-29 | 40,632 | 604,441 | 1,048,013 | |
| Jul-28 | 47,946 | 563,809 | 972,409 | |
| Jul-27 | 38,004 | 515,863 | 873,371 | |
| Jul-26 | 20,117 | 477,859 | 775,170 | |
| Jul-25 | 23,922 | 457,742 | 697,174 | |
| Jul-24 | 20,562 | 433,820 | 616,246 | |
| Jul-23 | 20,172 | 413,258 | 562,672 | |
| Jul-22 | 17,316 | 393,086 | 526,565 | |
| Jul-21 | 17,854 | 375,770 | 451,023 | |
| Jul-20 | 46,306 | 357,916 | 374,373 | |
| Jul-19 | 32,598 | 311,610 | 338,721 | |
| Jul-18 | 26,143 | 279,012 | 312,758 | |
| Jul-17 | 31,392 | 252,869 | 266,699 | |
| Jul-16 | 19,086 | 221,477 | 243,414 | |
| Jul-15 | 35,528 | 202,391 | 226,994 | |
| Jul-14 | 30,084 | 166,863 | 196,485 | |
| Jul-13 | 36,322 | 136,779 | 162,431 | |
| Jul-12 | 16,526 | 100,457 | 142,301 | |
| Jul-11 | 10,104 | 83,931 | 119,433 | |
| Jul-10 | 6,032 | 73,827 | 105,335 | |
| Jul-09 | 8,686 | 67,795 | 94,850 | |
| Jul-08 | 12,127 | 59,109 | 79,660 | |
| Jul-07 | 15,138 | 46,982 | 58,216 | |
| Jul-06 | 11,190 | 31,844 | 45,595 | |
| Jul-05 | 4,290 | 20,654 | 36,502 | |
| Jul-04 | 3,965 | 16,364 | 28,030 | |
| Jul-03 | 3,576 | 12,399 | 20,290 | |
| Jul-02 | 3,468 | 8,823 | 14,040 | |
| Jul-01 | 5,355 | 5,355 | 6,810 |
